what is the friend equation?


background

In my previous article, I discussed various equations used to estimate oxygen uptake during exercise. One in particular caught my fancy: The FRIEND equation, derived from the Fitness Registry and the Importance of Exercise National Database. Haven’t heard of the the FRIEND registry, yet? That’s okay, we’ll talk about what it is and how it’s being used to develop useful new tools for clinical and recreational exercise physiology.


What the heck is the friend registry? [2]

In 2014, a multi-institutional initiative was established, the primary objective of which was to establish normative cardiorespiratory fitness  values in the United States across the lifespan. Eight facilities from across the US (Connecticut, Indiana, Illinois, Louisiana Maryland, North Carolina, Tennessee and Texas) participated. Basically, researchers merged the data from many, many VO2max tests into one large cohort, following a standardized format such that the final cohort could be easily analyzed. 

Laboratories provided data on individuals who at the time of the test were without known cardiovascular disease or chronic obstructive pulmonary disease. Inclusion criteria were 1) participants be of age 20 years or older, 2) a maximal exercise test performed on a treadmill, 3) a peak respiratory exchange ratio (RER) of 1.00 or higher. Exclusion criteria were any tests that were terminated for abnormal clinical findings before reaching voluntary maximal effort. 

The final cohort includes 7783 tests; 4611 on men, 3172 on women. That’s a fairly large N for such a time-intensive procedure. Most of the VO2max studies I’ve read include around 20-40 participants.


What have we learned already?

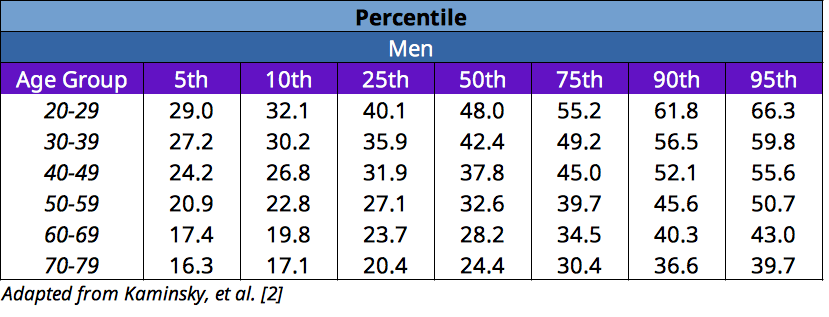
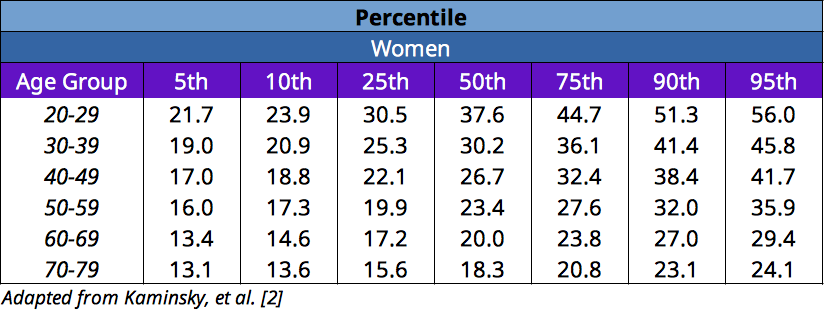
Well, for one thing, we have updated normative values for different age groups!

It has also given us some new cardiorespiratory fitness equations! Almost all VO2max equations have been derived by performing regression analyses on a group of individuals (this one included). This is fine and all, but generally yields an equation that is fairly useful for that population.If a study has 40 participants, the equation yielded probably works pretty well for those 40 people. That’s what sets this cohort apart; the sheer size and variety of the final dataset gives it a much greater likelihood of producing a predictive equation that is more generally applicable. 

According to publication date, the first equation derived from the FRIEND cohort came in the form of a reference equation to predict VO2max based on physical characteristics (age, gender and weight) [3].

  • VO2max (ml/kg/min) = 79.9 – (0.39 * age ) – (13.7 * gender) – (0.127 * weight)
    • Age is in years
    • Weight is in pounds
    • Gender is given as Male = 0, Female = 1
    • Standard error of the estimate = 7.2 ml/kg/min

The authors of this study also established a validation cohort, independent from the FRIEND cohort. The validation group had 1237 subjects and was of similar age, age range, BMI and proportion of males to females. Overall, the FRIEND equation did quite well in predicting VO2max when compared to direct measure. The table below summarizes the findings.

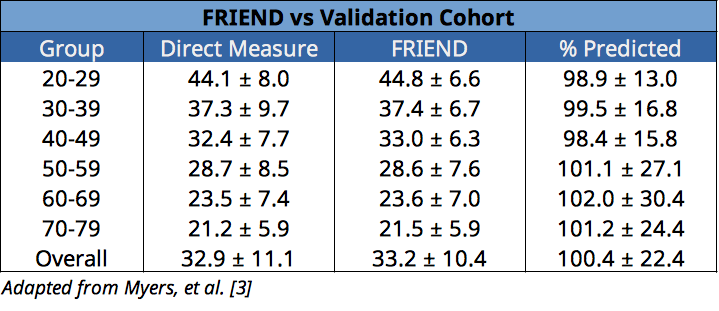
An overall percent prediction of 100.4 ± 22.4 is pretty darn good for an equation that simply takes physical characteristics into account. But what about an equation for a physical test that takes something like speed or grade into account?

I’m glad you asked. Kokkinos, et al. [4] used the FRIEND registry and regression analysis to do just that. They randomly selected 70% of the participants from the following age groups: <40, 40 to 50, 50-70 and ≥ 70 years. The remaining 30% were reserved for validation. They first had to decide which variable factored most heavily into determination of VO2max during a treadmill test. Their analysis yielded speed and grade as the most weight, with their final equation being

  • VO2max (ml/kg/min) = speed * [0.17 + (fractional grade * 0.79)] + 3.5
    • Where speed is in meters/minute and grade as a decimal (e.g. 0.05 for 5% grade)

Here’s where things get interesting. The authors then validated their equation against the remaining 30% of the cohort, and compared it’s accuracy to that of the ACSM equation utilizing a variety of testing protocols. They found the ACSM equations to overestimate VO2max with a percent error for the entire cohort of 21.4 ± 24.9, as opposed to the FRIEND equation’s 5.1 ± 18.3. The FRIEND equation was roughly four times more accurate. Something to consider is the fact the validation cohort was a subset of the entire FRIEND cohort, so additional validation with an independent cohort may be beneficial in the future.

And speaking of validation, a group of researchers out of Seoul just recently validated the new FRIEND equation in patients with coronary artery disease. Jang, et al. [6] did a direct comparison of measured VO2max, the FRIEND equation and ACSM’s equation and the results were pretty overwhelming. They found the ACSM equation overestimated CRF by 20% in men and by 16% in women. BUT, they found the FRIEND equation to accurately estimate CRF within a 1% error for men and women. ONE PERCENT ERROR. The really interesting thing is how the equation was derived from a group of individuals without cardiac disease [2], but it still ended being quite accurate for individuals with coronary artery disease.


So what?

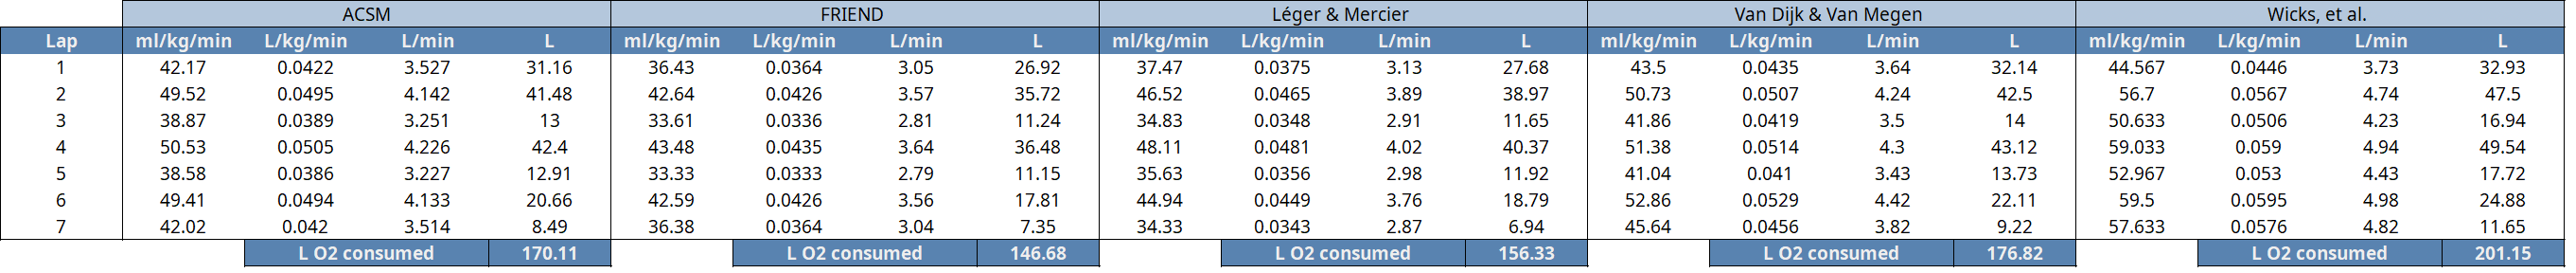
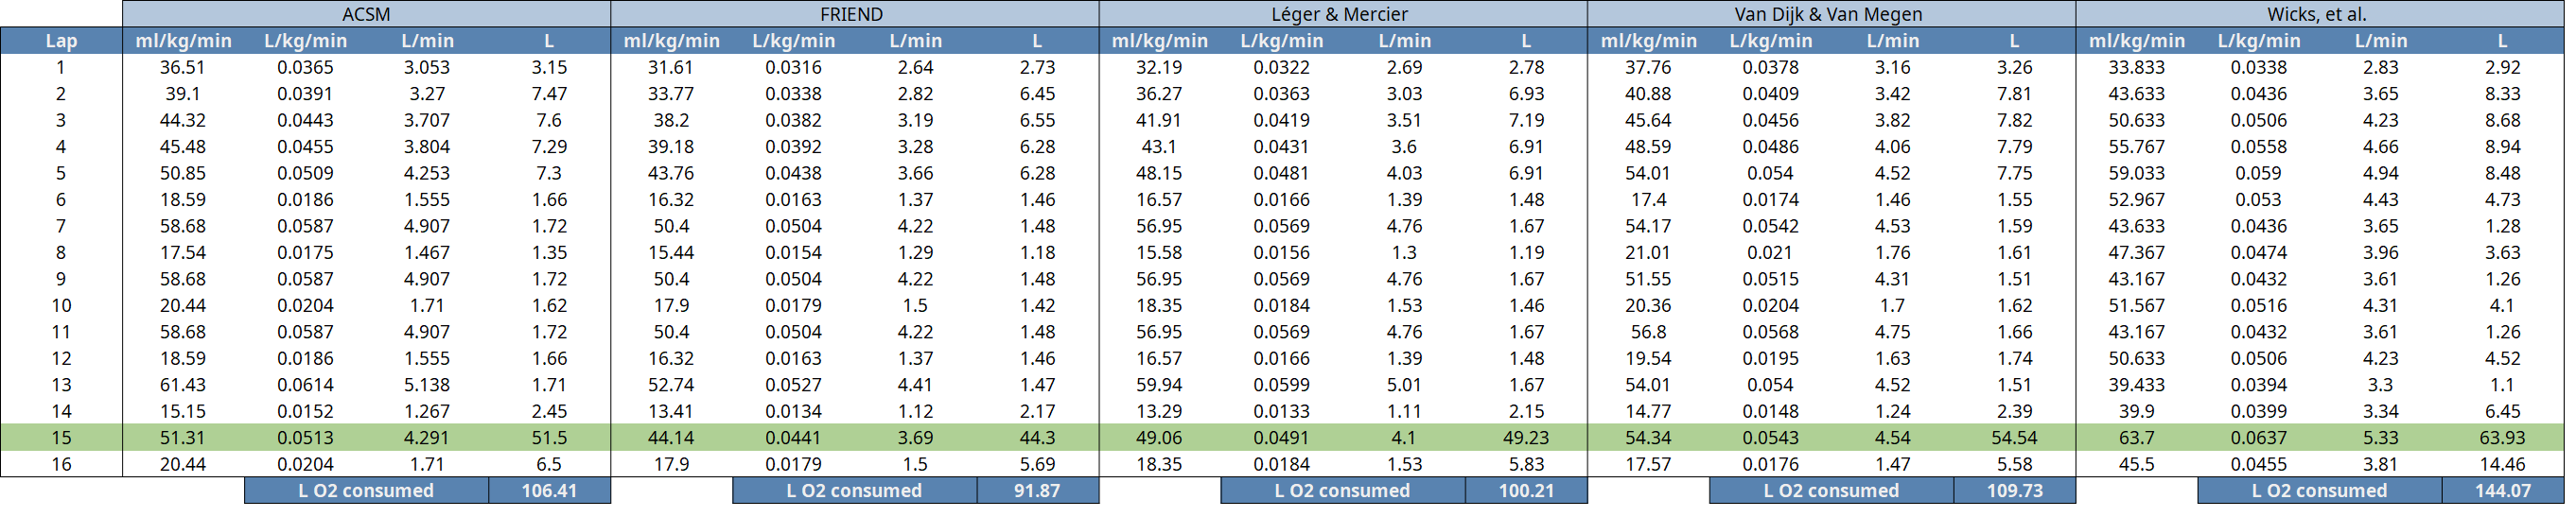
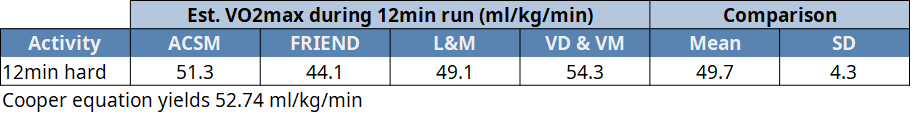
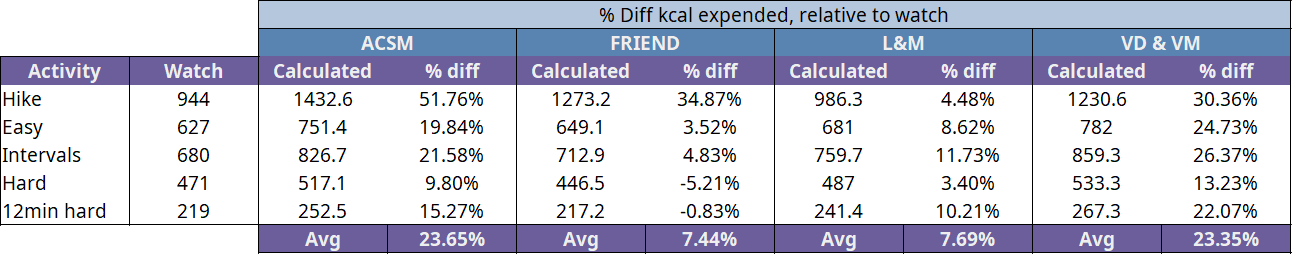
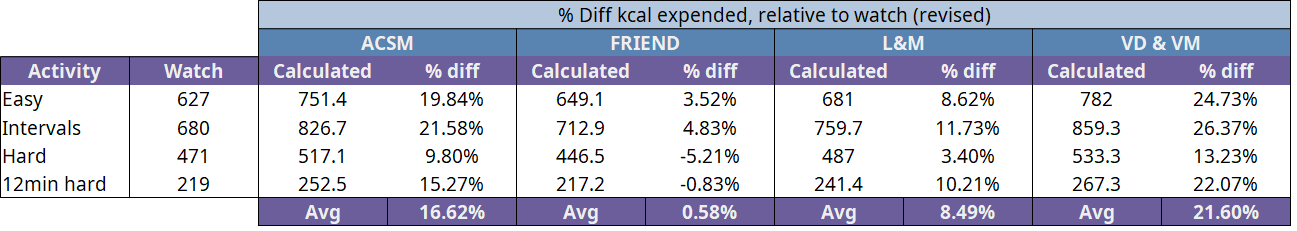
That’s nice and all, but how can I use this information? Well, the most applicable use would be in graded exercise testing. I mean, I can’t be the only one who has done their own Bruce protocol on the treadmill or a progressive running test on the track. Perhaps a new field test all together could be created? Something like a warmup and strides followed by 8 minutes all-out (most athletes can only maintain VO2max effort for 7-10 minutes). Then use the speed and grade (which may be 0, if it’s on the track) to calculate a predicted VO2max. I don’t know, I’m just spit-balling here. The other application might be to calculate energy expenditure, similar to what I did in my previous post comparing VO2 consumption equations. However, this particular equation would need further validation at submaximal intensities. But such a validation would also allow it to be useful in submaximal exercise prescription. For example, if one were to use the equation to calculate a VO2max, they could stratify their training into different intensities based on this VO2max. And those stratifications can be translated into paces by solving the equation for speed. Kind of like this:

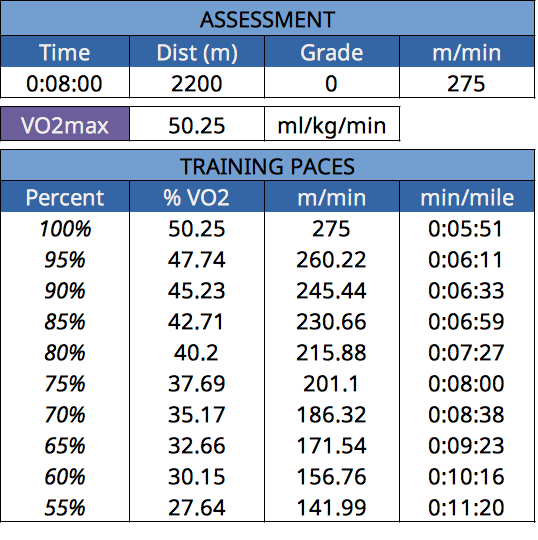
Anything above the predicted VO2max would theoretically be anaerobic. And again, this is all just presuming the FRIEND equation is at least somewhat valid at submaximal efforts. I haven’t tried this out for myself, yet. But with a new training block coming up, I’ll probably at least test it out. It’s at least fun to think about!


APPENDIX A: SUMMARY OF EQUATIONS

Myers, et al. [3]

  • VO2max (ml/kg/min) = 79.9 – (0.39 * age ) – (13.7 * gender) – (0.127 * weight)
    • Age is in years
    • Weight is in pounds
    • Gender is given as Male = 0, Female = 1.
    • Standard error of the estimate = 7.2 ml/kg/min
    • Predictive based on physical characteristics

Kokkinos, et al. [4]

  • VO2max (ml/kg/min) = speed * [0.17 + (fractional grade * 0.79)] + 3.5
    • Speed is in meters/minute
    • Grade as a decimal (e.g. 0.05 for 5% grade)

ACSM equations [8]

  • Running: VO2 (ml/kg/min) = (0.2 * speed) + (0.9 * speed * grade) + 3.5
  • Walking: VO2 (ml/kg/min) = (0.1 * speed) + (1.8 * speed * grade) + 3.5
    • Running equation for speeds > 5mph (12 min/mile)
    • Speed in meters/min
    • Grade in decimal (e.g. 5% grade -> 0.05)


REFERENCES

  1. Koutlianos N, Dimitros E, Metaxas T, Cansiz M, Deligiannis A, Kouidi E. Indirect estimation of VO2max in athletes by ACSM’s equation: valid or not?. Hippokratia. 2013;17(2):136-140.
  2. Kaminsky LA, Arena R, Myers J. Reference Standards for Cardiorespiratory Fitness Measured With Cardiopulmonary Exercise Testing: Data From the Fitness Registry and the Importance of Exercise National Database. Mayo Clin Proc. 2015;90(11):1515-1523. doi:10.1016/j.mayocp.2015.07.026
  3. Myers J, Kaminsky LA, Lima R, Christle JW, Ashley E, Arena R. A Reference Equation for Normal Standards for VO2 Max: Analysis from the Fitness Registry and the Importance of Exercise National Database (FRIEND Registry). Prog Cardiovasc Dis. 2017;60(1):21-29. doi:10.1016/j.pcad.2017.03.002
  4. Kokkinos P, Kaminsky LA, Arena R, Zhang J, Myers J. New Generalized Equation for Predicting Maximal Oxygen Uptake (from the Fitness Registry and the Importance of Exercise National Database). Am J Cardiol. 2017;120(4):688-692. doi:10.1016/j.amjcard.2017.05.037
  5. Kaminsky LA, Myers J, Arena R. Determining Cardiorespiratory Fitness With Precision: Compendium of Findings From the FRIEND Registry. Prog Cardiovasc Dis. 2019;62(1):76-82. doi:10.1016/j.pcad.2018.10.003
  6. Jang WY, Kang DO, Park Y, et al. Validation of FRIEND and ACSM Equations for Cardiorespiratory Fitness: Comparison to Direct Measurement in CAD Patients. J Clin Med. 2020;9(6):1889. Published 2020 Jun 17. doi:10.3390/jcm9061889
  7. Koutlianos N, Dimitros E, Metaxas T, Cansiz M, Deligiannis A, Kouidi E. Indirect estimation of VO2max in athletes by ACSM’s equation: valid or not?. Hippokratia. 2013;17(2):136-140.
  8. Thompson, W., Gordon, N. and Pescatello, L., 2010. ACSM’s Guidelines For Exercise Testing And Prescription. 8th ed. Philadelphia: Lippincott Williams & Wilkins, p.158.


Oxygen Consumption and Energy Expenditure


BACKGROUND

My previous post about caloric expenditure as estimated by wearable devices got me thinking. While I was in my undergraduate education for applied exercise science, we learned about the oxygen demand of caloric expenditure. In other words, as caloric requirements increase, oxygen demand also increases. Luckily, we have a handful of equations derived from exercise testing which estimate oxygen consumption. And we know how many kcals are liberated for each liter of O2 consumed. Could we just retrospectively apply these principles to an activity and more accurately estimate caloric expenditure? I really don’t know. BUT, the first step would be estimating O2 consumption during exercise.


ESTIMATION OF OXYGEN CONSUMPTION

There are a number of equations floating around to estimate the amount of oxygen consumed during activity. The most common of which is probably the American College of Sports Medicine (ACSM) equation [1].

The idea of their equation is:

  [O2 cost of running on level surface] 

+ [O2 cost of running up a grade] 

+ [baseline O2 cost at rest]

_______________________________________

= VO2 (ml/kg/min)

And is presented as:

  • Running: VO2 (ml/kg/min) = (0.2 * speed) + (0.9 * speed * grade) + 3.5 
  • Walking: VO2 (ml/kg/min) = (0.1 * speed) + (1.8 * speed * grade) + 3.5
    • Where speed is given in meters/minute and grade is in decimal form; e.g. use 0.08 for an 8% grade. 
    • Running equation used for speeds >5mph

Honestly, I had a hard time finding how/when these equations were derived. All I know is they were derived a while ago (on the scale of decades) and have been used for quite some time in research and clinical settings.

Another older (but interesting) equation I found is an amalgam of many equations. Léger and Mercier [2] evaluated data from published literature and found an average equation, weighted for the number of subjects in each study. In total, 130 subjects (trained and untrained males and females) and 10 treadmill studies were evaluated. The authors synthesized an equation for indoor/treadmill running as well as an additional modifier for wind resistance created by outdoor running.

  • Indoor/Treadmill: VO2 (ml/kg/min) = 2.209 + (3.163 * speed)
  • Outdoor (wind): VO2 (ml/kg/min) = 2.209 + (3.163 * speed) + (0.000525542 * speed^3)
    • Where speed is given in in km/hr

Next, in 2011, Wicks, et al. looked at 220 data sets from 60 studies and used regression analysis to develop an equation based on HR index [3]. Heart rate index is defined as (Heart rate) / (Resting heart rate). For example, a runner with a resting heart rate of 50, who is working at 155 bpm would have an HRindex of 155/50 = 3.1. Anyway, their equation is very simple and gives a number of metabolic equivalents (METs). One MET is the oxygen cost of sitting quietly; 3.5 ml/kg/min. Therefore, we’ll have to multiply the result of the Wicks equation by 3.5 to get ml/kg/min.

  • VO2 (ml/kg/min) = [(6 * HRindex) – 5] * 3.5
    • Where HRindex = HRabs / HRresting

Then, from January 1, 2014, through February 1, 2015, the Fitness Registry and the Importance of Exercise: A National Data Base (FRIEND) was created. Eight laboratories in the US performed 7783 maximal treadmill assessments with men and women between the age 20-79 without cardiovascular disease [4]. In 2017, Kaminsky, et al. performed a regression analysis on those 7783 data sets to create a new equation [5].

  • VO2 (ml/kg/min) = speed * (0.17 + decimal grade  * 0.79) + 3.5
    • Where speed is in meters/min

Finally, since I use power in my training, I figured I would include the VO2 estimation equations featured on Stryd’s blog [6]. I also like these because the power tabulated by the Stryd pod takes weight, speed, grade and wind into account. So, it ends up combining variables from all the other equations, except Wicks, et al. But, this is also under the assumption the power meter is valid and reliable.

  • Untrained athletes: VO2max (ml/kg/min) = 13.73 * P (<- I’d put myself in this category)
  • Trained athletes: VO2max (ml/kg/min) = 13.16 * P
  • Elite athletes: VO2max (ml/kg/min) = 12.63 * P
  • Where P is Watts/Kg as calculated by Stryd pod.


sO WHAT?

Well, I started wondering what would happen if I applied some of these equations to my own activities. So, I selected a few of my most recent activities to test some of these equations:

  • 6.33 mile hike 
    • Serious uphill out, downhill back. 
  • 5-mile easy run 
    • Not too much undulation, but slight downhill out, uphill back
  • 5.65-mile interval run  
    • A little more elevation change, but mostly wanted different intensities
  • 3.61 mile assessment run
    • Warmup, strides, 12-min Cooper test. All on the track.

If you want to investigate a split-by-split analysis, I’ve included those in Appendix B. But, for the “too long; didn’t read” crowd, here is the summary of those calculations:

You know what? Upon further investigation, this Wicks equation seems to be “way out there” when compared to the other four equations. I’m going to keep it in the lap-by-lap tables in Appendix B, but for the rest of this article, I’m just going to eliminate it from the rest of my analyses. Here’s an updated O2 table.

That’s better. A couple of things stand out to me in this table. First of all, it seems to demonstrate the specificity of these equations to running. The slowest activity (hiking) is a little “all over the place” when compared to the three runs. 

Additionally, as the runs became more difficult, there appears to be more agreement between equations. This makes sense since these were all derived by performing regression analyses on maximal efforts. But I don’t see it as completely unreasonable to apply these to submaximal efforts considering the well-established relationship between effort and O2 consumed.

I also thought it would be kind of interesting to compare the maximum oxygen uptake during the “12 minutes hard” portion of my assessment run.

Again, the harder the effort, the more agreement there seems to be between the various equations. I also think it’s interesting how close the average is to the Cooper equation. Considering my current training status and volume, it certainly seems to be in the ballpark.


Estimation of caloric expenditure

Okay, so now we have five equations to estimate oxygen consumption during exercise. BFD. How can we use this to estimate caloric expenditure?

To make an estimation of calories burned, we must relate calories to the volume of oxygen consumed. But we can use the respiratory exchange ratio (RER) for that! The RER is the ratio between the volume of CO2 expired to the volume of O2 consumed. 

RER = V̇CO2/V̇O2

The body normally uses a combination of fuels. At rest, RER is around 0.78 – 0.80. During exercise, muscles increasingly rely on carbohydrate for energy, resulting in a higher RER. As exercise intensity increases, the muscles’ carbohydrate demand also increases. As more carbohydrates are used, RER approaches 1.0. This increase in RER to 1.0 reflects the increased demand on blood glucose and muscle glycogen, but may also indicate more CO2 is being unloaded from the blood than is being produced by the muscles. [7]

Basically, the RER lets us estimate the relative contributions of substrates used to produce energy. The table below gives a few examples of RER values and the resultant percent contribution of carbohydrate and fats to energy production. (There is a contribution from protein being broken down, but it is negligible when compared to the energy being provided by carbohydrates and fat. Therefore, the RER is sometimes referred to as the “non-protein RER”.[7])

There’s a bit of organic chemistry that goes into deriving what percents of which substrate come from where; I’d recommend checking out the RER Wikipedia page for more information on that. The main thing we’re interested in is the “kcal/L O2” column. If we can (somewhat) accurately estimate the total volume of oxygen inspired during an activity, we can estimate the number calories expended. 

I applied this theory to the estimated O2 consumption tables tabulated earlier. For the overall comparison table, I used 4.86 kcal/L O2 primarily because each activity featured some “hard” periods (hills, intervals) and some “easy” periods. So, I figured it was probably a pretty safe bet.


Kind of interesting! In each case, the calories tabulated by the watch were less than the averages of estimates by the equations. This is in line with my previous article about wearables underestimating caloric expenditure.

Out of curiosity, I did the same thing to the 12-minute assessment portion of my hard run. Although, I used 4.92 kcal/L O2 since is was definitely intense, but not quite a maximal effort.

Lastly, I looked at percent difference of the equations, relative to the readings my watch gave me.

 (You can click for a larger version)

Somewhat surprisingly, the FRIEND and Léger and Mercier equations were the closest to what my watch reported. That’s not to say they performed the “best”; just the closest. As I mentioned before, the hike seems to be another outlier, possibly because these equations were derived from running studies. So, out of curiosity, I eliminated the hike to see how that would effect our overall % difference.

Well, now THAT’S surprising. The FRIEND equation performs quite closely to what my watch reports. Again, that’s not to say it performed “best”; just the closest.

Here’s the strange thing: The FRIEND equation is derived from almost 7800 VO2max tests performed on individuals without cardiovascular disease [4]. And it was recently validated in individuals with coronary artery disease (with crazy accuracy) [8]. So, as far as I know, it’s one of the more accurate equations we have. However, I just learned in my previous article that wearables tend to underestimate caloric expenditure. So, why is my Garmin Forerunner 935 so close to the FRIEND equation? Is the FRIEND equation also underestimating? Am I using the wrong RER value? Or maybe I’m the most average person of all time? Maybe my height, weight and training pace are all close enough to the averages Garmin (or Firstbeat or whoever) use to validate their proprietary expenditure equations such that my watch is actually fairly accurate for me? I don’t know. I don’t have a lab-tested VO2max to compare against.

So, if none of this can actually be validated, what does it all mean? Did I just waste a bunch of my time making tables and typing equations into Google Sheets for nothing? Did you just waste 10 or 15 or 20 minutes of your life reading this? Not necessarily. When it comes to something like O2 consumption and energy expenditure, the best we can do without a lab is use maths to estimate. And I think it’s worthwhile to investigate those estimates and come to some kind of useful conclusion we can use to improve our health and (hopefully) performance.


APPENDIX A: SUMMARY OF EQUATIONS

ACSM equations [1]

  • Running: VO2 (ml/kg/min) = (0.2 * speed) + (0.9 * speed * grade) + 3.5
  • Walking: VO2 (ml/kg/min) = (0.1 * speed) + (1.8 * speed * grade) + 3.5
    • Running equation for speeds > 5mph (12 min/mile)
    • Speed in meters/min
    • grade in decimal (e.g. 5% grade -> 0.05)

Léger and Mercier [2]

  • Indoor/Treadmill: VO2 (ml/kg/min) = 2.209 + (3.163 * speed)
  • Outdoor (wind): VO2 (ml/kg/min) = 2.209 + (3.163 * speed) + (0.000525542 * speed^3)
    • Speed in km/hr

Wicks et al [3]

  • VO2 (ml/kg/min) = [(6 * HRindex) – 5] * 3.5
    • HRindex = HR / RHR

FRIEND equation [5]

  • VO2 (ml/kg/min) = speed * [0.17 + (grade * 0.79)] + 3.5
    • Speed in meters/min
    • grade in decimal (e.g. 5% grade -> 0.05)

Stryd VO2max equations [6]

  • Untrained athletes: VO2max (ml/kg/min) = 13.73 * P
  • Trained athletes: VO2max (ml/kg/min) = 13.16 * P
  • Elite athletes: VO2max (ml/kg/min) = 12.63 * P
    • P = Watts/Kg

Cooper 12-minute VO2max equation [9]

  • VO2max (ml/kg/min) = (22.351 * Dist) – 11.288
  • Dist = kilometers covered in 12 minutes


Appendix B: Oxygen Consumption Tables

(Click on any for a larger picture)

Hike O2 consumption table, split every 0.25mi

 Easy run O2 consumption table, split every 1.00mi

 Interval run O2 consumption table, split every 1.00mi

 Cooper 12min assessment run; lap 15 is actual 12min run, everything beforehand is warm up and strides.


References


  1. Thompson, W., Gordon, N. and Pescatello, L., 2010. ACSM’s Guidelines For Exercise Testing And Prescription. 8th ed. Philadelphia: Lippincott Williams & Wilkins, p.158.
  2. Léger L, Mercier D. Gross energy cost of horizontal treadmill and track running. Sports Med. 1984;1(4):270-277. doi:10.2165/00007256-198401040-00003
  3. Wicks JR, Oldridge NB, Nielsen LK, Vickers CE. HR index–a simple method for the prediction of oxygen uptake. Med Sci Sports Exerc. 2011;43(10):2005-2012. doi:10.1249/MSS.0b013e318217276e
  4. Kaminsky LA, Arena R, Myers J. Reference Standards for Cardiorespiratory Fitness Measured With Cardiopulmonary Exercise Testing: Data From the Fitness Registry and the Importance of Exercise National Database. Mayo Clin Proc. 2015;90(11):1515-1523. doi:10.1016/j.mayocp.2015.07.026
  5. Kokkinos P, Kaminsky LA, Arena R, Zhang J, Myers J. New Generalized Equation for Predicting Maximal Oxygen Uptake (from the Fitness Registry and the Importance of Exercise National Database). Am J Cardiol. 2017;120(4):688-692. doi:10.1016/j.amjcard.2017.05.037
  6. Van Dijk, H. and Van Megen, R., 2020. How To Use Stryd Power To Calculate Your VO2. [online] Stryd Blog. Available at: <https://blog.stryd.com/2019/12/06/how-to-use-stryd-power-to-calculate-your-vo2/> [Accessed 27 August 2020].
  7. Wilmore, J., Costill, D. and Kenney, W., 2008. Physiology Of Sport And Exercise. 4th ed. Champaign, Ill.: Human Kinetics, p.103-104.
  8. Jang WY, Kang DO, Park Y, et al. Validation of FRIEND and ACSM Equations for Cardiorespiratory Fitness: Comparison to Direct Measurement in CAD Patients. J Clin Med. 2020;9(6):1889. Published 2020 Jun 17. doi:10.3390/jcm9061889
  9. Bandyopadhyay A. Validity of Cooper’s 12-minute run test for estimation of maximum oxygen uptake in male university students. Biol Sport. 2015;32(1):59-63. doi:10.5604/20831862.1127283